Search:
Flight Projects | Sciences and Exploration
OMSO2 Release Specific Information
Software Version
The current release of collection 3 OMSO2 (algorithm version 1.1.1) data is the second public release of the sulfur-dioxide products derived from OMI observations. Changes from the previous version (V1.0.0) are listed below, in the Release History.
Known Issues List
This section describes significant issues related to the OMSO2 v1.1.1 product:
1. ĀĀĀNegative SO2 artifacts of about 1 DU are produced when upper level troughs (high total ozone) amplify and extend across the ozone profile climatology boundary between middle and high latitudes.Ā The current OMTO3 algorithm generates false residuals due to use of the wrong ozone profile.
|
Col 3 V1.1.1 |
|
|
|
|
Col2 V0.9.6 |
|
|
|
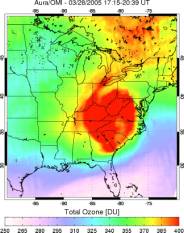
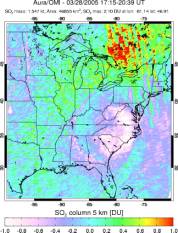
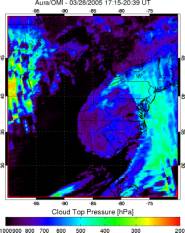
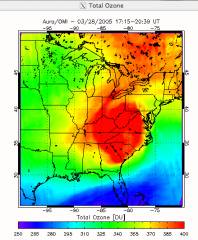
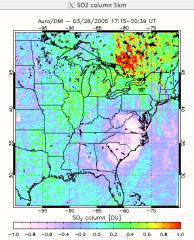
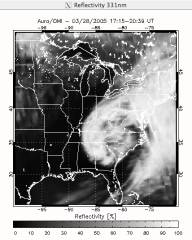
Figure 1.Ā An
example of negative SO2 retrievals
over southeast United States due to use of improper ozone profile climatology. It looks like the sliding residual correction might have been dragged down
by the negative SO2Ā region
so that high positive SO2 shows up north of that region
2. ĀĀĀSO2 artifacts (both significant positive and negative SO2 values) are sometimes observed over cloudy regions, especially at the edges of clouds. They are possibly due to the incomplete corrections of Ring effects or wavelength shifts in the measured radiance or a combination of these two effects.
3. ĀĀĀThe retrieved SO2 has displayed some broad patterns (region with negative values) that are usually associated with low radiances, such as the measurements at high ozone or high solar zenith angles, typical conditions at the high latitude regions. The measurements of low radiances are affected more by stray lights and the intrinsic instrument noises.
4. ĀĀĀIncorrect (too low) terrain pressure or radiative cloud pressures (RCP) lead to erroneous fill values in the TRL data. Incorrect (low) RCP can also lead to fill values in TRM data fields due to the blocking of the signals from the a priori SO2 profile that is completely under the high cloud.
5. ĀĀĀThe intrinsic noise in OMI radiance measurements leads to noise in SO2 retrievals. This intrinsic SO2 noise is at level higher than the typical signals from anthropogenic SO2 pollutions. Consequently daily observations of anthropogenic SO2 are limited to area with high concentrations (> 10ppb.). Note that the pixel quality flags in OMSO2 are reliable in identification of the true SO2 signals for high loading (> 10 D.U.) cases, but are less reliable for low signal cases due to the intrinsic SO2 noises.
6. ĀĀData collected over the South Atlantic and South America (from southern Peru southward) are affected by the South Atlantic Anomaly (SAA). Higher particle fluxes in this region result in random isolated spikes in SO2.
Release History
V1.1.1 OMSO2 contains the following changes from the previous release V0.9.6:
1. OMSO2 produces 4 different estimates of the column density of SO2 in Dobson Units (1DU=2.69 ∙1016 molecules/cm2) obtained under the different assumptions about the vertical distribution of the SO2. Table 1 shows new and old SO2 data names and description for each product.
2. V.1.1.1 OMSO2 uses new input data from collection V1.1.0 OMTO3 (for changes in the new OMTO3, please refers to its release specific information). One of the significant improvement in V1.1.0 OMTO3 is the switch from IR climatological cloud-top pressure to UV Radiative Cloud Pressure (RCP) inferred from Rotational-Raman Scattering (OMCLDRR). This switch has greatly reduced the Ring signature in the OMTO3 residuals, resulting in significant improvements in SO2 retrievals under cloudy conditions (Figure 1).
3. V.1.1.1 OMSO2 provides new ancillary information copied from pre-processing algorithms. See Table 2 for details.
4. Algorithm change:Ā In V1.1.1 OMSO2 PBL data field no longer contains fill value for reflectivity greater than 30%.Ā Although, we do not recommend using this product when the radiative cloud fraction (RCF) exceeds 0.2, the PBL data are provided for error analysis purposes. The TRL data contain filled values when terrain pressure or RCP is less than ~500hPa. In such cases the cloud blocks most of the SO2. As a result, the SO2 weighting function approaches zero, no LF retrieval is done and the fill value is stored in the output. . The cloud-related fill values in TRM data occurs only when the OMI measured cloud top is higher than ~8-10 km. In general the number of cloud related filled values have reduced. In the STL (former 15 KM) product, the same criteria are applied, but no cloud is high enough to block the SO2. Retrievals are always attempted. One should see no fill values due to cloud blocking in the STL data field.
5. Algorithm change: in V1.1.1 OMSO2 sliding median uses only pixels with minimal cloud contamination (RCF < 0.15), while all pixels were used before (RCF < =1).
6. Algorithm change : Threshold for SO2 consistency flag is relaxed, it was 0.5 now it is 1.0. This means more pixels would be considered good SO2 pixels.
7. Algorithm change: Replace 0 with fill value (-999) for QAPercentCloudCover, QAPercentMissingData and QAPercentOutofBoundsData.
Table 1: SO2 data
field names with associated algorithm and quality flags
|
V. 0.9.6Ā names |
V1.1.1Ā names |
Description |
|
SO2ColumnAmount_PBL |
ColumnAmountSO2_PBL AlgorithmFlag_PBL QualityFlags_PBL |
Planetary Boundary Layer (PBL) SO2 column, corresponding to CMA of 0.9km, processed with BRD algorithm [Krotkov et al 2006, 2008]. |
|
N/A |
ColumnAmountSO2_TRL AlgorithmFlag_TRL QualityFlags_TRL |
Lower tropospheric SO2 column, corresponding to CMA of 2.5 km, processed with Linear Fit (LF) algorithm [Yang et al 2007]. |
|
SO2ColumnAmount_05KM |
ColumnAmountSO2_TRM AlgorithmFlag_TRL QualityFlags_TRL |
Middle tropospheric SO2 column, usually produced by volcanic degassing, corresponding to CMA of 7.5 km, processed with LF algorithm. |
|
SO2ColumnAmount_15KM |
ColumnAmountSO2_STL AlgorithmFlag_STL QualityFlags_STL |
Upper tropospheric and Stratospheric SO2 column, usually produced by explosive volcanic eruption, corresponding to CMA of 17 km. processed with LF algorithm. |
|
|
OMSO2 V 0.9.6Ā |
OMSO2 V 1.1.1 |
|
cloud fraction |
|
|
|
|
|
|
|
Total Ozone |
|
|
|
SO2 ¢ TRM (5km) |
|
|
|
Region statistics |
Mean SO2 for region (PBL): 0.233 SO2 Std Dev (PBL): 1.076 N/A Mean SO2 for region (5 km): 0.102 SO2 Std Dev (5 km): 0.281 Mean SO2 for region (15 km): 0.069 SO2 Std Dev (15 km): 0.160 Mean SOI_P1 for region: 0.167 SOI_P1 Std Dev: 0.133 Mean SOI_P2 for region: 0.058 SOI_P2 Std Dev: 0.153 Mean SOI_P3 for region: 0.160 SOI_P3 Std Dev: 0.095 |
Mean SO2 for region (PBL): -0.096Ā
SO2 Std Dev (PBL): 1.256 Mean SO2 for region (TRL): 0.066ĀĀ
SO2Ā Std Dev (TRL): 0.436 Mean SO2 for region (TRM): 0.040Ā
SO2 Std Dev (TRM): 0.178 Mean SO2 for region (STL): 0.033ĀĀ
SO2 Std Dev (STL): 0.146 Mean SOI_P1 for region: 0.136 SOI_P1 Std Dev: 0.122 Mean SOI_P2 for region: 0.144 SOI_P2 Std Dev: 0.091 Mean SOI_P3 for region: 0.156 SOI_P3 Std Dev: 0.098 |
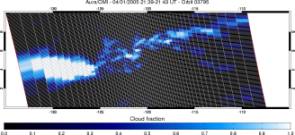
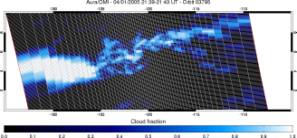
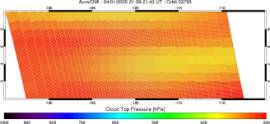
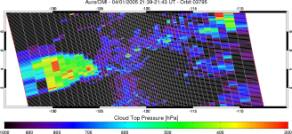
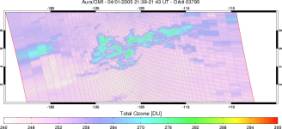
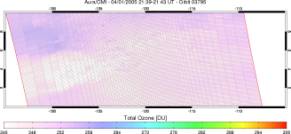
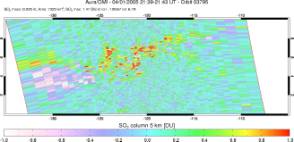
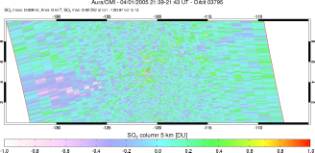
Figure 2 ITCZ region of dense and scattered clouds. Using
IR cloud heights, total ozone (Row 2) shows positive artifacts up to 30 DU; SO2
(Row 3) shows positive artifacts up to 2 DU.Ā Using RR RCP, positive artifacts are used in both ozone and
sulfur dioxide.Ā Negative artifacts
remain in both over dense clouds.
Table
2 Revised names for ancillary output data fields
|
V. 1.0.0Ā name |
V1.1.1Ā name |
Comment |
|
N/A |
LayerEfficiency factor (nLayers) OMTO3 V1.1.0 |
OMTO3 Ozone Layer
Efficiency factor. Used to approximate SO2 weighting function. |
|
CloudTopPressure OMTO3 V0.9.45 |
CloudPressure OMTO3 V1.1.0 |
Radiative Cloud Pressure (RCP) inferred from Rotational-Raman Scattering (OMCLDRR) to derive the total column ozone. Since the pressure corresponding to RCP is usually significantly below the cloud-top pressure climatology assumed in the V8 algorithm, the V8.5 derived column amounts have decreased over clouds. The magnitude of the decrease depends on cloud fraction, location, and solar zenith angle. Please refer to release specific information about OMTO3 for details |
|
CloudFraction OMTO3 V0.9.45 |
RadiativeCloudFraction OMTO3 V1.1.0 |
The effective cloud fraction (fc) derived from the MLER model is used to estimate the Radiative Cloud Fraction (RCF). RCF characterizes the fraction of measured radiation that is scattered by clouds. |
Prior version
changes:
First public OMSO2 v0.9.6 contains several modifications
from the provisional release (OMSO2 v0.9.29.1). The
primary differences are in the new temperature dependent SO2 cross sections
data [Bogumil et al 2000], new residual correction for background regions,
different parameterization of the Air Mass Factors, and in high SO2 volcanic
retrievals:
- Instrument calibration errors are corrected by assuming median residuals are zero in background regions for each scan position (moving median method).Ā This correction removes latitude dependent zero offsets in the retrievals.Ā
- When the atmospheric SO2 loading is low (<10 DU), the linear Band Residual Difference (BRD) algorithm (Krotkov et al., 2006) is suitable for SO2 retrieval.
- For strong volcanic degassing and eruptions, SO2 loading can be very large and the BRD algorithm may fail. The new linear Fit (LF) algorithm has been developed to optimally select residuals from the set of available OMTO3 bands to retrieve SO2 under these conditions. The LF algorithm minimizes a subset of the residuals by simultaneously adjusting VC SO2, total column ozone, reflectivity at 331nm, and polynomial coefficients (linear and quadratic) to account for the wavelength dependent effect of surface albedo and aerosol on the effective reflectivity. In the OMSO2 product, 5 km and 15 km data processed with the LF algorithm are provided, in addition to BRD retrievals for the same vertical distributions.
The Maximum Likelihood spectral fit algorithm originally developed for operational SO2 processing will be operationally employed when the OMI instrument calibration is better understood. This algorithm has maximum sensitivity for SO2 in the PBL. For a description of this algorithm please refer to ATBD-OMI-04, OMI Trace Gas Algorithms, in Algorithm Theoretical Basis Document (ATBD), which also contains other algorithm related documents.
References
Carn, S. A., A. J. Krueger, N. A. Krotkov, K. Yang, and P. F. Levelt (2007a), Sulfur dioxide emissions from Peruvian copper smelters detected by the Ozone Monitoring Instrument, Geophys. Res. Lett., 34, L09801, doi:10.1029/2006GL029020.
Carn, S.A., N.A. Krotkov, K. Yang, R.M. Hoff, A.J. Prata, A.J. Krueger, S.C. Loughlin, and P.F. Levelt (2007b), Extended observations of volcanic SO2 and sulfate aerosol in the stratosphere, Atmos. Chem. Phys. Discuss., 7, 2857-2871. (http://www.atmos-chem-phys-discuss.net/7/2857/2007/acpd-7-2857-2007.html)
Carn, S.A., A.J. Krueger, N.A. Krotkov, S. Arellano, and K. Yang (2008a), Daily monitoring of Ecuadorian volcanic degassing from space, J. Volcanol. Geotherm. Res., (in press).
Carn, S.A., A.J. Krueger, N.A. Krotkov, K. Yang, and K. Evans (2008b), Tracking volcanic sulfur dioxide clouds for aviation hazard mitigation. Natural Hazards, Special Issue on Aviation Hazards from Volcanoes (in press).
Krotkov,N.A., B. McClure, R. Dickerson, S. Carn, Can Li, P.K. Bhartia, K. Yang, A. Krueger, Z. Li, P. Levelt, H. Chen, P.Wang, and D. Lu (2008), Ozone Monitoring Instrument (OMI) SO2 validation over NE China, J. Geophys. Res., Aura validationĀ special issue, (in press)
Krotkov, N.A., S.A. Carn, A.J. Krueger, P.K. Bhartia, and K. Yang (2006). Band residual difference algorithm for retrieval of SO2 from the Aura Ozone Monitoring Instrument (OMI). IEEE Trans.Geosci. Remote Sensing, AURA special issue, 44(5), 1259-1266, doi:10.1109/TGRS.2005.861932, 2006
Krueger, A.J., L.S. Walter, P.K. Bhartia, C.C. Schnetzler, N.A. Krotkov, I. Sprod, and G.J.S. Bluth (1995) Volcanic sulfur dioxide measurements from the total ozone mapping spectrometer instruments. J. Geophys. Res., 100(D7), 14057-14076, 10.1029/95JD01222.
Bogumil, K., J. Orphal, T. Homann, S. Voigt, P. Spietz, O.C. Fleischmann, A. Vogel, M. Hartmann, H. Kromminga, H. Bovensmann, J. Frerick, J.P. Burrows (2003), Measurements of molecular absorption spectra with the SCIAMACHY pre-flight model: instrument characterization and reference data for atmospheric remote-sensing in the 230-2380nm region, Journal of Photochemistry and Photobiology, A:Chemistry, 157 , 167-184.
Yang, K., N. Krotkov, A. Krueger, S. Carn, P. K. Bhartia, and P. Levelt (2007), Retrieval of Large Volcanic SO2 columns from the Aura Ozone Monitoring Instrument (OMI): Comparisons and Limitations, J. Geophys. Res., 112, D24S43, doi:10.1029/2007JD008825